How to train, tune, and validate a machine learning model
This is the fourth in a four-part series on how we approach machine learning at Feature Labs. The complete set of articles can be found below:
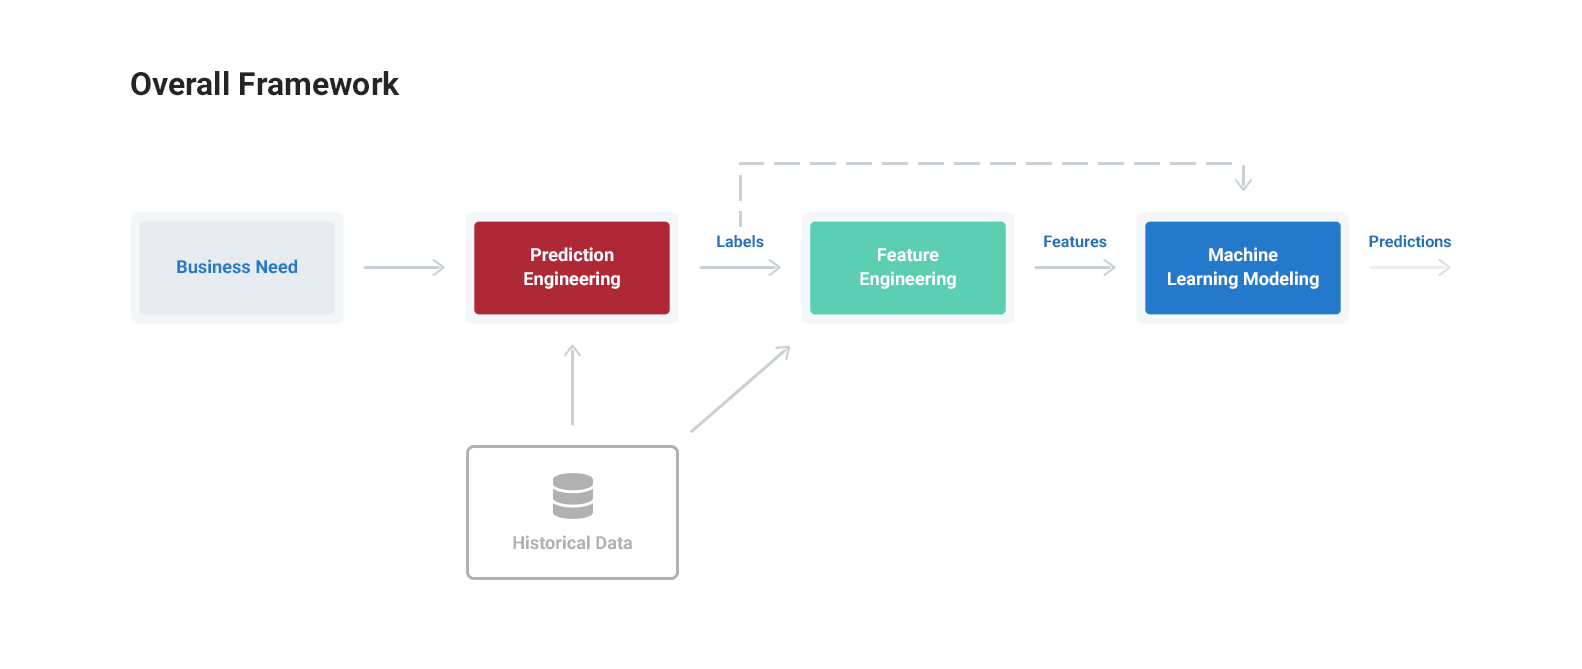
- Overview: A General-Purpose Framework for Machine Learning
- Prediction Engineering: How to Set Up Your Machine Learning Problem
- Feature Engineering: What Powers Machine Learning
- Modeling: Teaching an Algorithm (this article)
These articles cover the concepts and a full implementation as applied to predicting customer churn. The project Jupyter Notebooks are all available on GitHub. (Full disclosure: I work for Feature Labs, a startup developing tooling, including Featuretools, for solving problems with machine learning. All of the work documented here was completed with open-source tools and data.)
The Machine Learning Modeling ProcessThe outputs of prediction and feature engineering are a set of label times, historical examples of what we want to predict, and features, predictor variables used to train a model to predict the label. The process of modeling means training a machine learning algorithm to predict the labels from the features, tuning it for the business need, and validating it on holdout data.
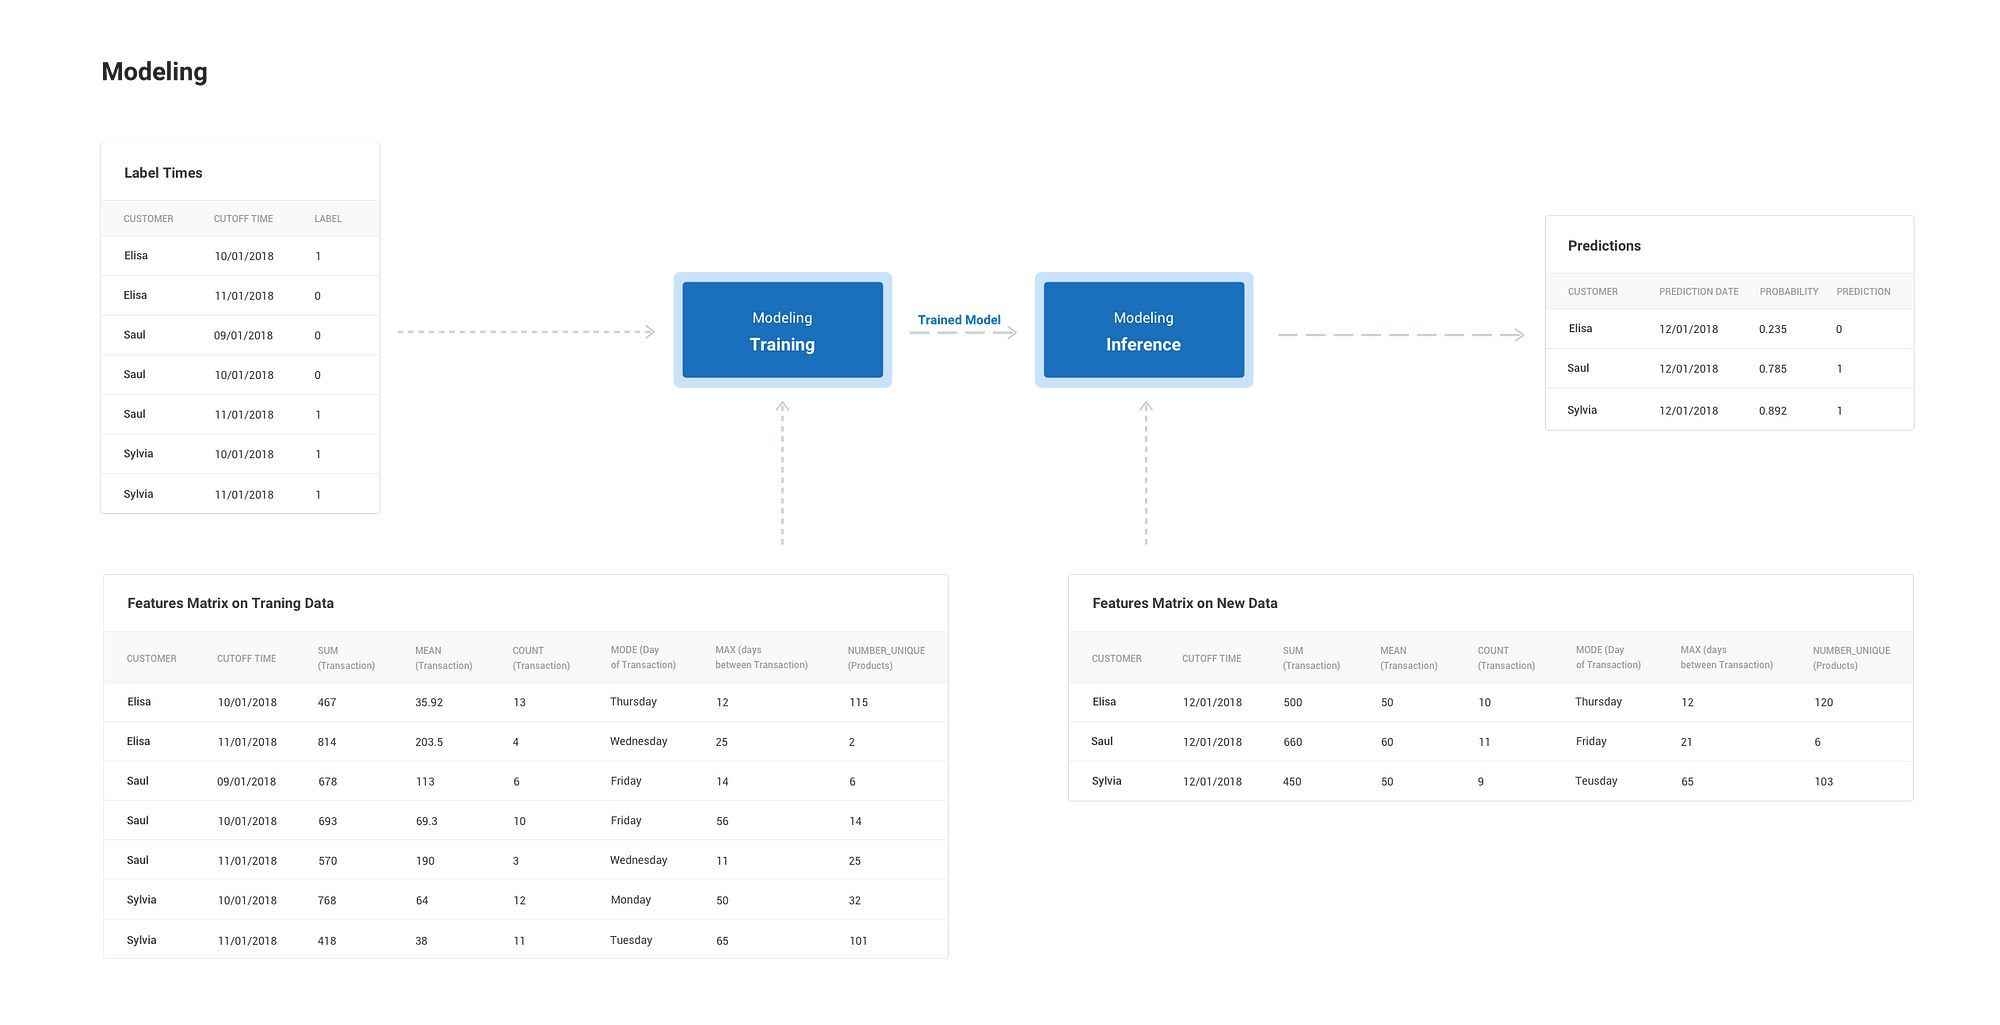
The output from modeling is a trained model that can be used for inference, making predictions on new data points.
The objective of machine learning is not a model that does well on training data, but one that demonstrates it satisfies the business need and can be deployed on live data.
Similar to feature engineering, modeling is independent of the previous steps in the machine learning process and has standardized inputs which means we can alter the prediction problem without needing to rewrite all our code. If the business requirements change, we can generate new label times, build corresponding features, and input them into the model.
Implementation of Modeling for Customer Churn
In this series, we are using machine learning to solve the customer churn problem. There are several ways to formulate the task, but our definition is:
Predict on the first of each month which customers will churn during the month. Use a lead time of one month and churn is 31 days with no subscription. With a lead time of 1 month, this means we make predictions 1 month in advance: on January 1, we make predictions of churn during the month of February.
Although machine learning algorithms may sound technically complex, implementing them in Python is simple thanks to standard machine learning libraries like Scikit-Learn. As a bit of practical advice, empirical results have shown that the choice of machine learning model and hyperparameters matters, but not as much as feature engineering.
Therefore, the rational decision is to put most of the effort into prediction and feature engineering, and insert a pre-built solution for machine learning.
In this project, I went with Scikit-Learn to rapidly implement a few models. To get the data ready for machine learning, we have to take some basic steps: missing value imputation, encoding of categorical variables, and optionally feature selection if the input dimension is too large (see notebook for full details). Then, we can create a model with standard modeling syntax:
Metrics and Baseline Results
Before applying machine learning, it’s best to establish a naive baseline to determine if machine learning is actually helping. With a classification problem, this can be as simple as guessing the majority label in the training data for all examples in the hold-out testing data. For the customer churn data, guessing every test label is not a churn yields an accuracy of 96.5%.
This high accuracy may sound impressive, but for an imbalanced classification problem — where one class is represented more than another — accuracy is not an adequate metric. Instead, we want to use recall, precision, or the F1 score.
Recall represents the percentage of actual churns in the data that our model identifies with the naive guess recording 3.5%. Precision measures the percentage of churns predicted by our model that actually were churns, with a naive score of 1.0%. The F1 score is the harmonic mean of these measures.
Since this is a classification problem, for a machine learning baseline I tried a logistic regression which did not perform well. This indicates the problem is likely non-linear, so my second attempt used a Random Forest Classifier with better results. The random forest is quick to train, relatively interpretable, highly accurate and is usually a solid model choice.
The metrics for no machine learning, logistic regression, and the random forest with default hyperparameters are shown below:
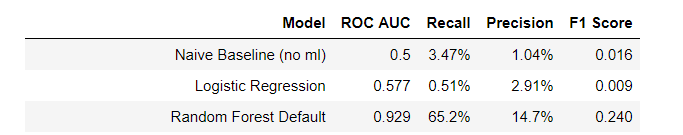
Each model was evaluated using about 30% of the data for holdout testing based on a time-series split. (This is crucial when evaluating a model in a time-series problem because it prevents training data leakage and should provide a good estimate of the actual model performance on new data.)
Aligning the Model with the Business Requirement
Even though the metrics for the ml models are better than with no machine learning, we want to optimize a model for a given metric(s) in line with the business need. In this example, we’ll focus on recall and precision. We will tune the model to achieve a certain recall by adjusting the threshold, the probability above which an observation is classified as positive — a churn.
Precision and Recall Tuning
There is a fundamental tradeoff in machine learning between recall and precision, which means we can increase one only at the cost of decreasing the other. For example, if we want to find every instance of churn — a recall of 100% — then we would have to accept a low precision — many false positives. Conversely, if we limit the false positives by increasing the precision, then we will identify fewer of the actual churns lowering the recall.
The balance between these two is altered by adjusting the model’s threshold. We can visualize this in the model’s precision-recall curve.
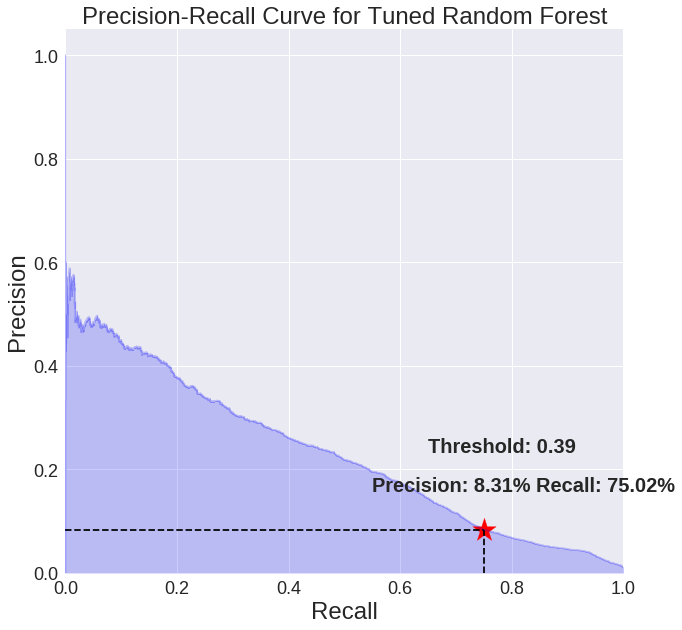
This shows the precision versus the recall for different values of the threshold. The default threshold in Scikit-Learn is 0.5, but depending on the business needs, we can adjust this to achieve desired performance.
For customer churn we’ll tune the threshold to achieve a recall of 75%. By inspecting the predicted probabilities (the actual values), we determine the threshold should be 0.39 to hit this mark. At a threshold of 0.39, our recall is 75% and our precision is 8.31%.
Choosing the recall or precision lies in the business domain. It requires determining which is more costly, false positives — predicting a customer will churn when in fact they will not — or false negatives — predicting a customer will not churn when in fact they will — and adjusting appropriately.
A recall of 75% was chosen as an example optimization but this can be changed. At this value, compared to the naive baseline, we have achieved a 20x improvement in recall and an 8x improvement in precision.
Model Validation
Once we have selected the threshold for classifying a churn, we can plot the confusion matrix from the holdout testing set to examine the predictions.
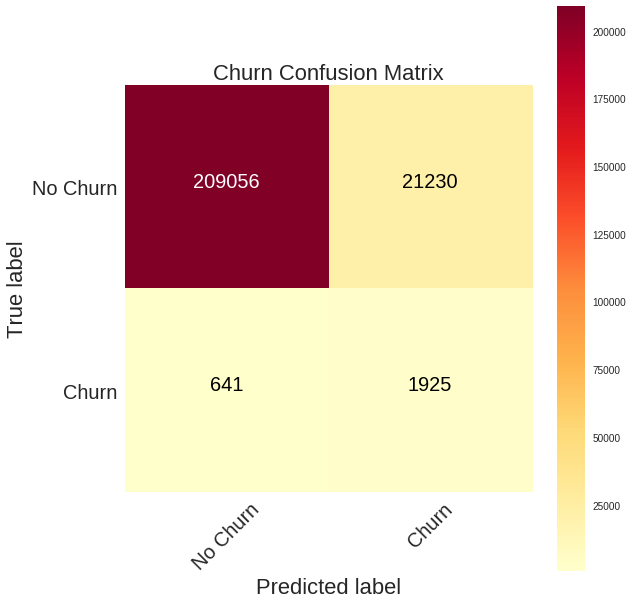
At this threshold, we identify more than half the churns (75%) although with a significant number of false positives (upper right). Depending on the relative cost of false negatives vs false positives, our model might not actually be an improvement!To make sure our model has solved the problem, we need to use the holdout results to calculate the return from implementing the model.
Validating Business Value
Using the model’s metrics on the hold-out testing set as an estimate of performance on new data, we can calculate the value of deploying this model before deploying it. Using the historical data, we first calculate the typical revenue lost to churn and then the reduced amount of revenue lost to churn with a model that achieves 75% recall and 8% precision.
Making a few assumptions about customer conversions (see notebook for details) we arrive at the following conclusion:
Machine learning increases the number of active monthly subscribers and recoups 13.5% of the monthly losses from customer churns.
Considering a subscription cost, this represents $130,000 (USD) per month.
With these numbers, we conclude that machine learning has solved the business need of increasing monthly subscribers and delivered a positive solution.
As a final piece of model interpretation, we can look at the most important features to get a sense of the variables most relevant to the problem. The 10 most important variables from the random forest model are shown below:
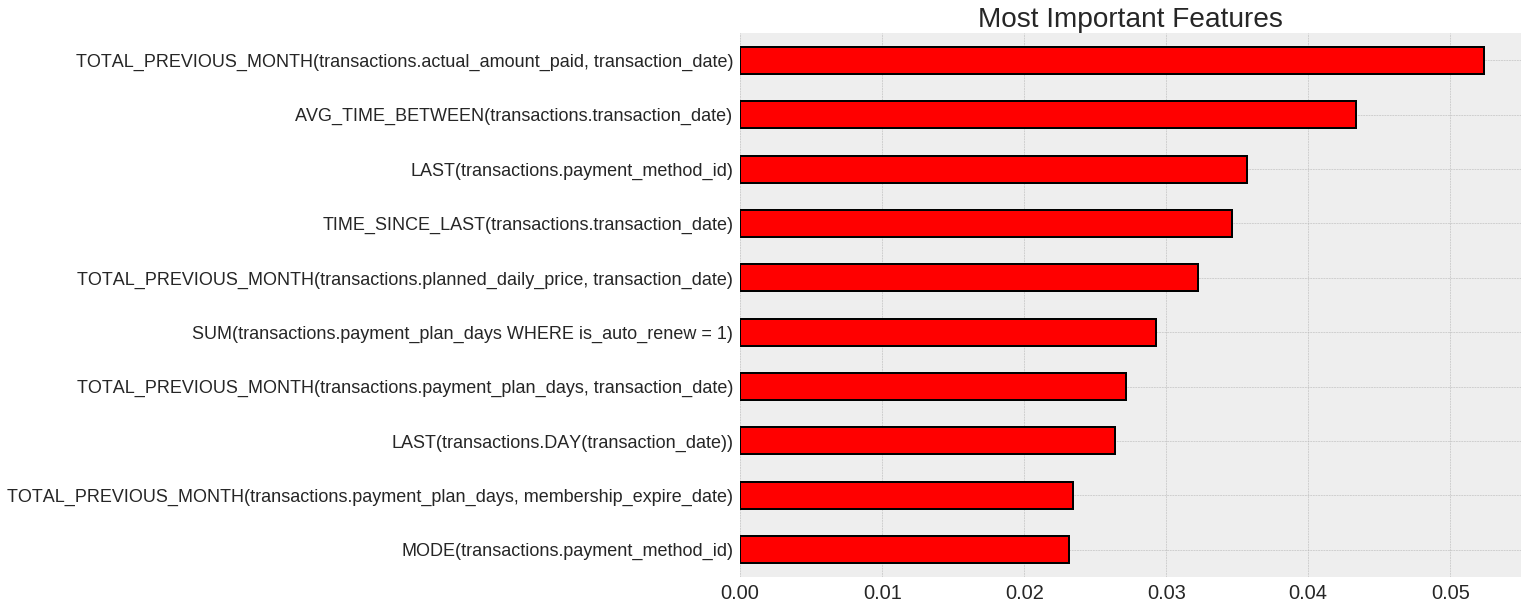
The most important variables agree with our intuition for the problem. For instance, the most important feature is the total spending in the month before the cutoff time. Because we are using a lead time of 1 month, this represents the spending two months prior to the month of prediction. The more customers spent in this period, the less likely they were to churn. We also see top features like the average time between transactions or method of payment id, which could be important to monitor for our business.
Making Predictions and Deployment
With our machine learning pipeline complete and the model validated, we are ready to make predictions of future customer churn. We don’t have live data for this project, but if we did, we could make predictions like the following:
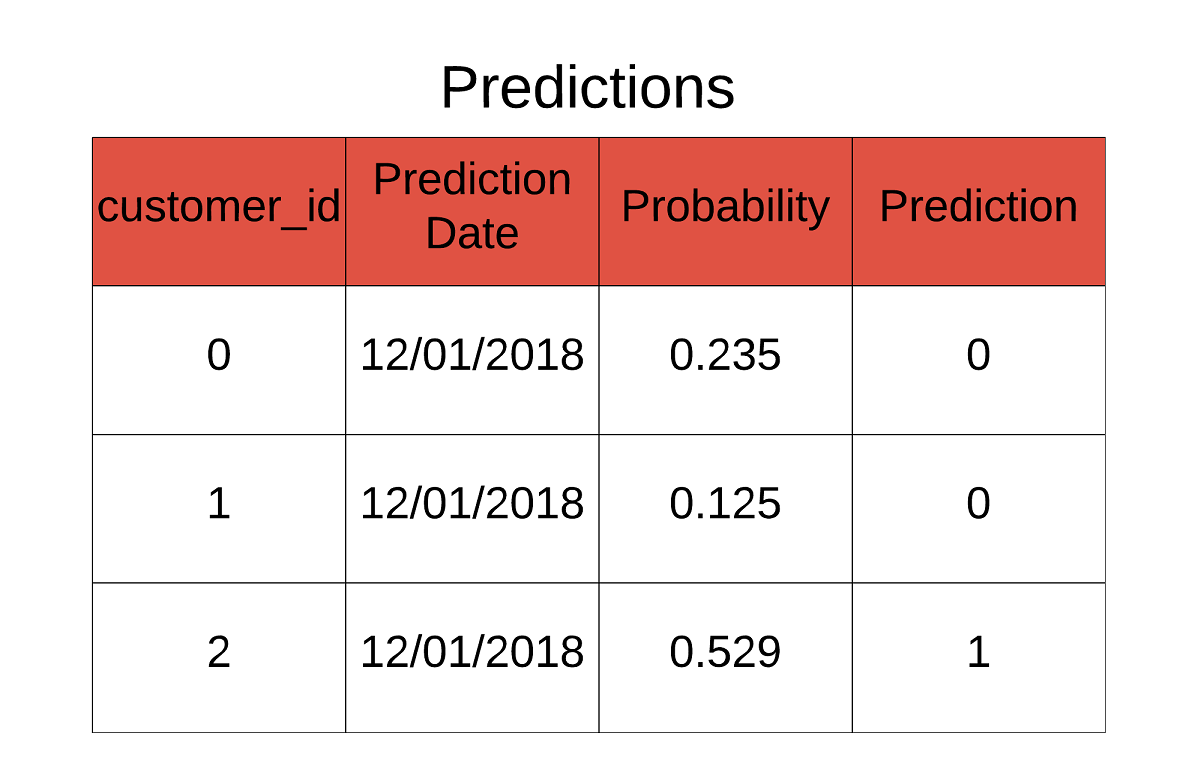
These predictions and feature importances can go to the customer engagement team where they will do the hard work of retaining members.
In addition to making predictions each time we get new data, we’ll want to continue to validate our solution once it has been deployed. This means comparing model predictions to actual outcomes and looking at the data to check for concept drift. If performance decreases below the level of providing value, we can gather and train on more data, change the prediction problem, optimize the model settings, or adjust the tuned threshold.
Modeling Notes
As with prediction and feature engineering, the modeling stage is adaptable to new prediction problems and uses common tools in data science. Each step in the machine learning framework we use is segmented, meaning we are able to implement solutions to numerous problems without needing to rewrite all the code. Moreover, the APIs — Pandas, Featuretools, and Scikit-Learn — are user-friendly, have great documentation, and abstract away the tedious details.
Conclusions for the Machine Learning Process
The future of machine learning lies not in one-off solutions but in a general-purpose framework allowing data scientists to rapidly develop solutions for all the problems they face. This scaffolding functions in much the same way as website templates: each time we build a website, we don’t start from scratch, we use an existing template and fill in the details.
The same methodology should apply to solving problems with machine learning: instead of building a new solution for each problem, adapt an existing scaffolding and fill in the details with user-friendly tooling.
In this series of articles, we walked through the concepts and use of a general-purpose framework for solving real-world machine learning problems.
The process is summarized in three steps:
- Prediction Engineering: Define a business need, translate the need into a supervised machine learning problem, and create labeled examples
- Feature Engineering: Use label times and raw historical data to build predictor variables for each label
- Modeling: Train, tune for the business need, validate the value of solution, and make predictions with a machine learning algorithm
While machine learning is not a sacred art available only to a select few, it has remained out of the reach of many organizations because of the lack of standardized processes. The objective of this framework is to make machine learning solutions easier to develop and deploy, which will allow more organizations to see the benefits of leveraging this powerful technology.
If building meaningful, high-performance predictive models is something you care about, then get in touch with us at Feature Labs. While this project was completed with the open-source Featuretools, the commercial product offers additional tools and support for creating machine learning solutions.